Benchmarks, Dashboards & KPIs (Oh My!)
It all started with a combination of fax machines and Microsoft Excel back in the 90’s. Our small franchise brand of about 30 retail units began tracking our Key Performance Indicators (KPIs) very simply. We just wanted these four basic data points from each retail store:
- Traffic: How many people came through the door today?
- Sales: How many invoices today resulted in how much sales volume?
- Average Ticket: Simply dividing the sales volume by the number of invoices.
- Close Ratio: Simple again; number of customer visits versus the number of invoices written.
Originally, we required handwritten traffic logs from each location that were faxed into our offices to tell us how many people visited each retail store. From those faxes, we manually entered these data points into Excel, and then pushed back to our franchisees what we called “Quad Charts” with the most pertinent retail trends updated every 10 day. Eventually, with our data points building for each location, we were able to shown historic trends of what was accomplished in the same 10 day period for the prior year.
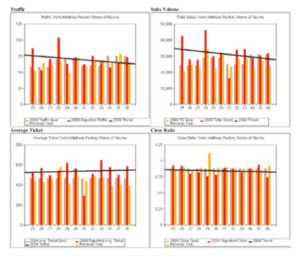
90’s Quad Chart tracking Traffic, Sales, Avg. Ticket & Close Ratio.
These “Quad Chart” quickly evolved to include an annual benchmark meeting we had with each franchisee. It always started with a simple question – What are your sales goals for this store in the new year? From that, we had enough historic information to know that we didn’t even divide that number by 12, but created an algorythm for each location that would help us properly allot the target number across all 12 months to account for seasonality within our industry. Those monthly benchmark calculations then found their way into the Quad Chart so that franchisees could at a glance see a dozen of their last 10 day periods, how that compared to the prior year and where they stood versus their own sales goals for the current year. Perfect – right?
And then NOTHING happened.
Even with all these faxes coming in from dozens of stores from six different states, and expensive annual meetings to extract sales goals from each franchisee, nothing really changed. We were spending a lot of time and resources to track all of this information but it felt like it existed in a vacuum that no one paid much attention to but the corporate staff and the franchisees at the annual meeting. We completely bought into the theory of “If you can’t measure it, you can’t improve it” but we didn’t get the improvement part, until…
Collaborative Quad Charts for Frontline Staff
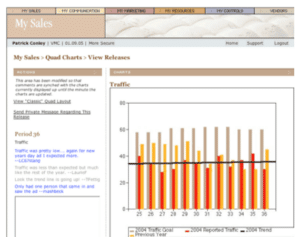
QuadCharts get collaborative behind the Intranet.
Beyond developing these systems for measuring KPI’s, by the late 90’s we were also developing an intranet system for franchisees, their managers and frontline retail staff. Managers could see what was happening at all of the locations that their franchisee operated, while retail employees only saw what was happening within their location. But within this secured system, we began to publish Top 10 lists of which stores had the best average ticket yesterday, which stores had the best close ratio last week and which locations saw the biggest improvements in traffic for this month versus last year. All of this data became powerful motivation for the frontline retail workers, who were frequently left in the dark about benchmarks and goals the franchisee had set. Suddenly, they could clearly see what others were accomplishing and they became highly compelled to compete! And, because the Quad Charts had now moved online, the frontline staff also had the ability to comment and exchange messages about their performance on any given day.
While this little history lesson might be helpful to some, the reality is that two decades later, our available tools are significantly more impressive. Later this month our Top 2 Bottom team will be getting more closely aligned with companies like FranMetrics and ProfitKeeper, as many of our franchisor clients seek out these latest dashboard platforms that can quickly and clearly communicate to their franchisees, and beyond. If the time has come for your endless streams of accounting and sales data to finally be used productively within your franchise organization, please contact our Top 2 Bottom franchise team today to schedule a 30 minute discovery call to learn about the many possibilities for your franchise brand!